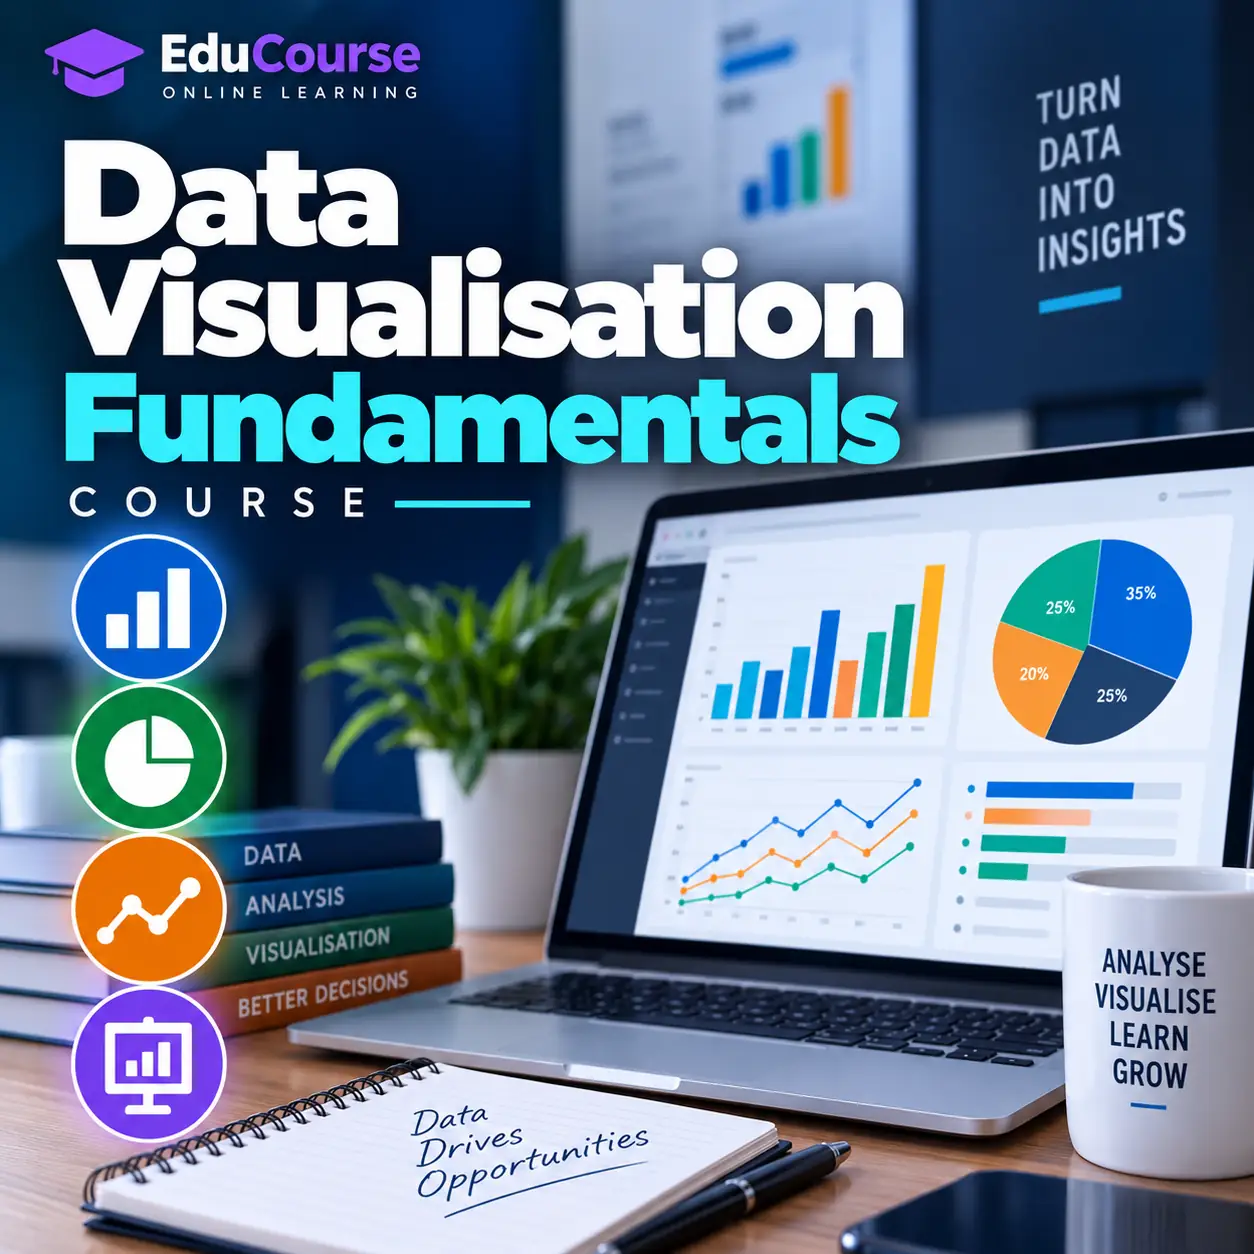
Study a Free Data Visualisation Fundamentals Course with Certificate in South Africa with Durban City Academy. Learn data Visualisation, importance of Data.
10 lessons with topics and quizzes.
The Free Data Visualisation Fundamentals Course with Certificate in South Africa is designed for learners who want to quickly master the essentials of transforming raw data into clear, impactful visuals. This fully online course offers practical skills, from creating charts and dashboards to applying visual analytics in real-world scenarios. South African learners can study anytime and earn a certificate on completion to showcase their new expertise.
This beginner-friendly course suits anyone keen to develop data visualisation skills, whether you're a student, professional, or workplace learner. You'll explore core concepts like data types, design principles, and popular free tools widely used locally and globally. The course breaks down complex ideas into digestible lessons, making it easy to start building practical skills from day one.
Data visualisation is the art and science of representing data graphically to reveal patterns, trends, and insights at a glance. For beginners, learning these fundamentals provides a strong foundation to communicate data effectively in business, cyber security, and other fields. This introductory training helps South Africans gain confidence with data-driven decision-making through visuals.
Online learning has become a powerful option in South Africa, offering flexible access to quality courses like this one. Access from anywhere, pause and replay lessons, and benefit from guided steps focused on relevant skills. The free certification enhances your profile, making this an ideal starting point for exploring AI, analytics, and cyber security careers or personal growth.
In today’s data-rich environment, knowing how to prepare and visualise information correctly is key. This course emphasizes using free and open-source software popular in South Africa, alongside ethical best practices. It also highlights data privacy and accuracy — critical considerations in workplaces and online spaces.
Durban City Academy aims to empower South Africans with cutting-edge digital skills. This course, updated for 2026, reflects the evolving landscape and the growing demand for data literacy across industries and sectors nationally.
In South Africa’s fast-growing digital economy, data literacy is increasingly required across careers and industries. Visual skills help make complex information clear, driving better outcomes in business strategy, cyber security, and operational management.
This course meets a vital need for beginner online training that is tailored to South African learners, using relevant tools and examples. It’s perfect for upskilling or entry-level workplace training where practical, certificate-backed courses add real value.
As organisations depend more on data for competitive advantage, those who communicate data insights effectively will have an edge. This makes data visualisation a sought-after skill and a stepping stone to roles in AI, analytics, and security.
Discover the basics of what data visualisation is and why it matters in various fields including cyber security.
Learn when to use bar charts, line graphs, pie charts, scatter plots, and more to best communicate your message.
Get to know popular free and open-source tools accessible in South Africa, plus online platforms for building visuals.
Understand how to collect, clean, and organise data so it’s ready for effective representation.
Explore key design elements like colour, shape, size, and clarity to avoid misleading visuals.
Step through building your own charts using free tools and learn how to export and share them professionally.
Develop skills to read charts accurately, spot trends, and truly understand the story behind the data.
See how visuals support cyber security decisions through threat mapping, incident reporting, and real-time dashboards.
Learn about maintaining data privacy, avoiding bias, and ensuring your visuals remain truthful and transparent.
Get guidance on continuing your learning journey with advanced resources and building a portfolio for career growth.
10 lessons with topics and quizzes covered in this course.
South African learners gain free access to a course tailored to local needs, with practical examples of data visualisation applied across industries widely present in the country.
With South Africa’s expanding investment in AI, digital infrastructure, and cyber security, acquiring foundational data presentation skills makes you more competitive in the job market.
This training supports workplace learning objectives, especially in environments adopting data-driven processes but lacking formal in-house courses. The online format ensures access across regions without travel or cost barriers.
Successful course completion enhances your CV with a relevant certificate recognised by numerous employers and institutions. It also opens doors to advanced AI and cyber security courses offered by Durban City Academy.
Upon finishing all lessons and assessments, you will receive an official certificate from Durban City Academy. There are no costs associated with earning this certificate, and you can download or share it digitally.
The certificate confirms your understanding of data visualisation fundamentals and validates your readiness to apply these skills practically. It can boost your professional profile and support career or academic progression.
Yes, this is a completely free training course designed for South African learners. You can access all content online without any charge and earn a free certificate upon completion.
Upon completing all course lessons and assessments, you receive a certificate of completion from Durban City Academy to showcase your data visualisation skills.
Absolutely. The course is designed for beginners with no prior experience in data visualisation. It guides you step-by-step through foundational concepts and practical applications.
Most learners complete the course within 2 to 4 hours. You can study at your own pace with flexible online access.
You will learn to prepare, design, build, and interpret various data visualisations using free tools. This includes charts, dashboards, ethical practices, and visual analytics in cyber security.
Yes, this course is fully online and tailored for South African learners, providing accessible and relevant skills through remote learning.